Introduction
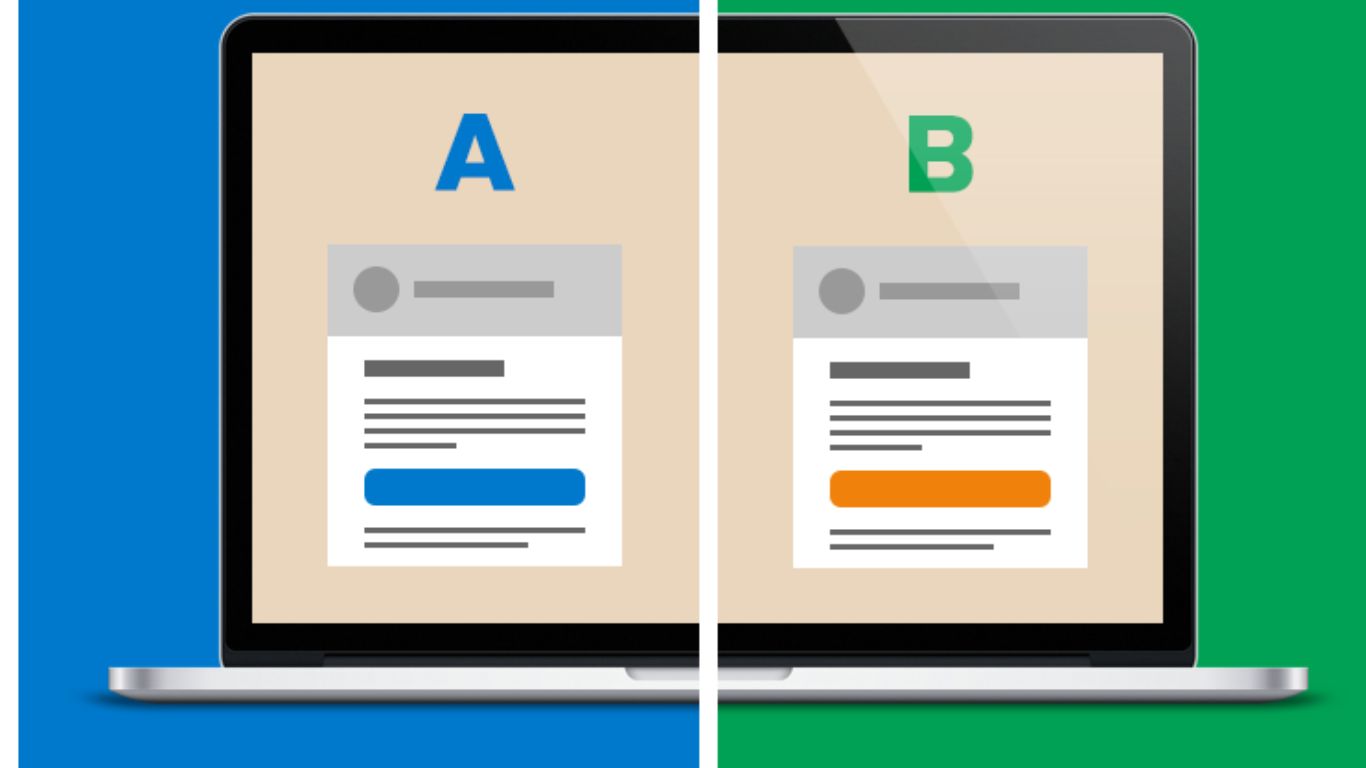
A/B tests, often known as randomised controlled trials, is the gold standard for proving causal inference. The Python Data Science course contains additional information on A/B testing in Python. Before implementing the treatment, RCTs rigorously account for the randomization process and guarantee equitable distributions across factors. As a result, the intervention is to blame for the mean difference between the treatment and control groups.
The Stable Unit Treatment Value Assumption, or SUTVA, is the most critical of the minor assumptions that underlie good A/B tests. It states that there is no interaction between the treatment and control units since interference would result in inaccurate estimates.
This article will discuss the steps involved in analysing an A/B experiment, including developing a hypothesis, testing it, and evaluating the findings.
We’ll do-:
-
Designing our experiment
-
Collecting and preparing the data
-
Visualising the results
-
Testing the hypothesis
-
Drawing conclusions
1. Designing our experiment
-
Formulating a hypothesis
First things first, we start off by developing a hypothesis for the project. This will guarantee that our interpretation of the findings is accurate and rigorous.
-
Choosing the variables
We’ll need two groups for our test:
A control group – Who will be exposed to the previous design.
A treatment group—also known as an experimental group—will be shown the new layout.
Our independent variable will be this. Even though we are aware of the baseline conversion rate, we still have two groups because we want to account for other factors that may affect our results, such as seasonality. By having a control group, we can compare their results to those of the treatment group since there is only a small amount of systematic variation between the groups—the design of the product page—and we can therefore directly attribute any differences in results to the designs.
-
Choosing a sample size
The fact that we won’t test every user means that the conversion rates we receive will necessarily be simply estimates, but this fact also increases the likelihood that we will be able to identify a difference between the two groups, assuming one exists.
2. Collecting and preparing the data
After obtaining the necessary sample size, we must gather the data. At this step, you would typically work with your team to set up the experiment, possibly with assistance from the engineering team, and ensure that you gather enough data in accordance with the required sample size.
3. Sampling
Following the technique for gathering and preparing the data, we must move forward and sample n=4720 records for each of the groups. To do this, we may utilise the DataFrame.sample() method in pandas, which will carry out Simple Random Sampling on our behalf.
4. Visualising the results
The first thing we may do in this stage is calculated some fundamental statistics to get a general notion of how our sample appears.
5. Testing the hypothesis
Our analysis’s final stage is to put our theory to the test. You can calculate our p-value using the usual approximation if you have a very big sample size.
Conclusion
In conclusion, although A/B testing has been around for at least a century, it only became popular in its current form in the 1990s. With the advent of big data and the online environment, it has now gained importance. Companies can conduct tests more easily and use the data to improve user experience and performance.
The accredited Python data science course from FutureSkills Prime teaches you how to use a variety of tools for doing A/B testing, but a data scientist must also comprehend the underlying principles.


