The world of technical analysis is replete with tools and indicators designed to help traders and investors make informed decisions in the complex realm of financial markets. Among these tools, the Moving Average Convergence Divergence (MACD) indicator stands out as one of the most versatile and widely used. In this comprehensive guide, we will delve into the depths of MACD, exploring its origins, components, interpretation, and practical applications in the world of trading.
Understanding the Origins of MACD
The MACD indicator was developed by Gerald Appel in the late 1970s. Appel, a renowned technical analyst and author, sought to create a tool that would help traders identify changes in momentum and potential trend reversals. The result was MACD, which has since become a staple in the toolkit of both novice and experienced traders.
The Components of MACD
MACD is composed of several elements that work together to provide valuable insights into price momentum and trend direction. Let’s break down its key components:
-
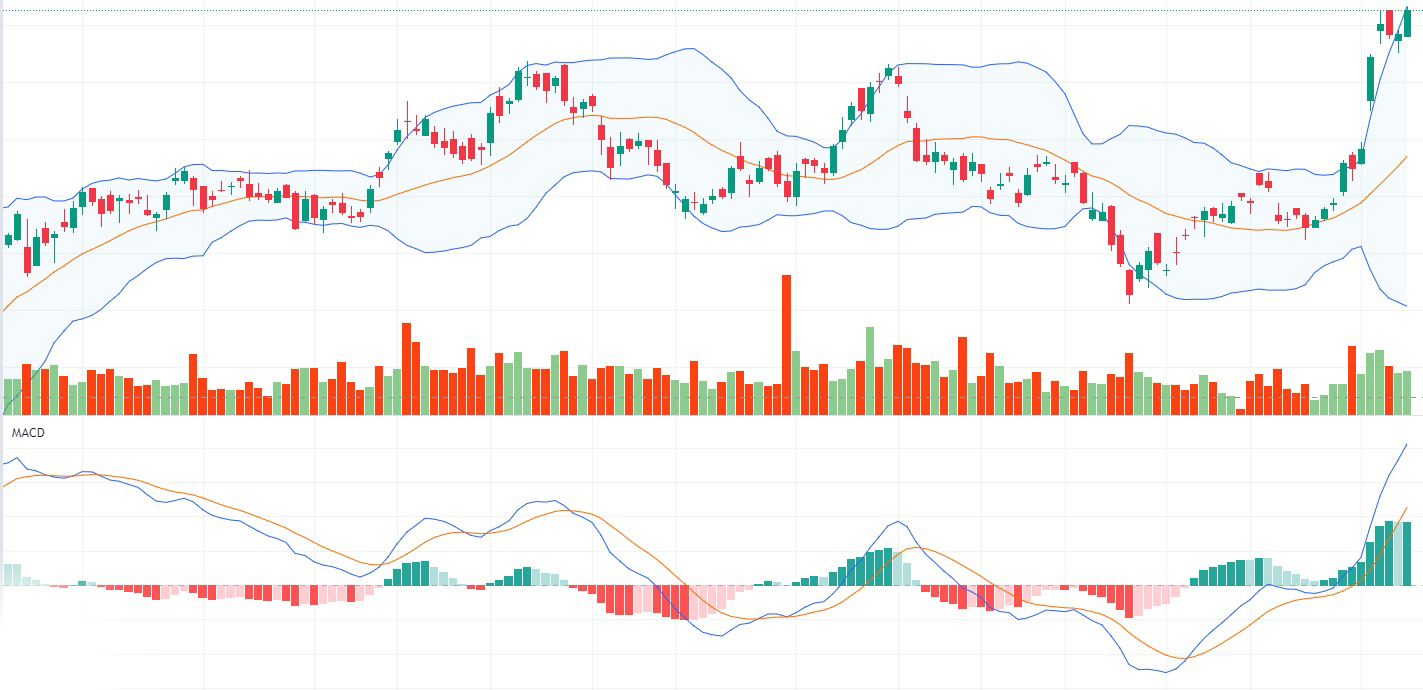
MACD Line: The MACD line is the heart of the indicator. It is calculated by subtracting a longer-term exponential moving average (EMA) from a shorter-term EMA. Commonly, the 12-period EMA is subtracted from the 26-period EMA to create the MACD line.
-
Signal Line: The signal line is a 9-period EMA of the MACD line. It is used to generate trading signals and smooth out the MACD line’s fluctuations.
-
Histogram: The histogram represents the difference between the MACD line and the signal line. It provides a visual representation of the MACD’s relationship with the signal line and helps traders identify potential crossovers.
Interpreting MACD
To effectively use the MACD indicator, traders must understand how to interpret its signals and patterns:
-
Crossovers: One of the primary uses of MACD is to identify bullish and bearish crossovers. A bullish crossover occurs when the MACD line crosses above the signal line, signaling a potential uptrend. Conversely, a bearish crossover happens when the MACD line crosses below the signal line, suggesting a potential downtrend.
-
Divergence: MACD can also reveal divergence between its movements and the price of the asset being analyzed. Bullish divergence occurs when the price makes lower lows, but the MACD makes higher lows. This can indicate a potential reversal to the upside. On the other hand, bearish divergence is seen when the price makes higher highs while the MACD makes lower highs, signaling a potential reversal to the downside.
-
Histogram Patterns: The histogram’s bars can help traders gauge the strength of a trend. Wider bars suggest strong momentum, while narrower bars indicate weakening momentum. A rising histogram can confirm an uptrend, while a falling histogram may confirm a downtrend.
-
Overbought and Oversold Conditions: Although not a primary function of MACD, traders sometimes use it to identify overbought and oversold conditions. When the MACD rises significantly above zero, it may indicate an overbought market. Conversely, when it falls significantly below zero, it may suggest an oversold market.
Practical Applications of MACD
Now that we’ve explored the fundamentals of MACD, let’s delve into its practical applications in trading and investment:
-
Trend Identification: MACD is invaluable for identifying trends, whether they are bullish or bearish. Traders often use crossovers to confirm trend changes and adjust their positions accordingly.
-
Confirmation of Momentum: By examining the MACD histogram, traders can confirm the strength of a trend. Strong momentum often accompanies wide histogram bars, providing confidence in the direction of the trend.
-
Entry and Exit Signals: MACD crossovers and divergence patterns can generate entry and exit signals. Traders can enter positions when a bullish crossover or divergence occurs and exit when a bearish crossover or divergence signals a potential reversal.
-
Risk Management: The MACD indicator can aid in setting stop-loss levels and determining the timing of exits. This helps traders manage risk and protect their capital.
-
Timeframe Flexibility: MACD can be applied to various timeframes, from minutes in day trading to weeks or months in long-term investing. Its adaptability makes it suitable for traders with different strategies and preferences.
Conclusion
The Moving Average Convergence Divergence (MACD) indicator is a powerful tool that has earned its place among the essential instruments in technical analysis. Its ability to identify trends, confirm momentum, and generate entry and exit signals makes it indispensable for traders and investors alike.
However, like any tool in the financial markets, MACD is not infallible. It should be used in conjunction with other indicators and analysis methods to make well-informed trading decisions. Additionally, traders should practice risk management and discipline to navigate the complexities of the market successfully.
In conclusion, mastering MACD requires time, practice, and a deep understanding of its components and interpretations. It is a valuable addition to any trader’s toolbox, offering insights into market dynamics that can enhance trading strategies and decision-making processes.